Posts about:

Charting Library

Create a pie chart with NodeJS and LightningChart JS

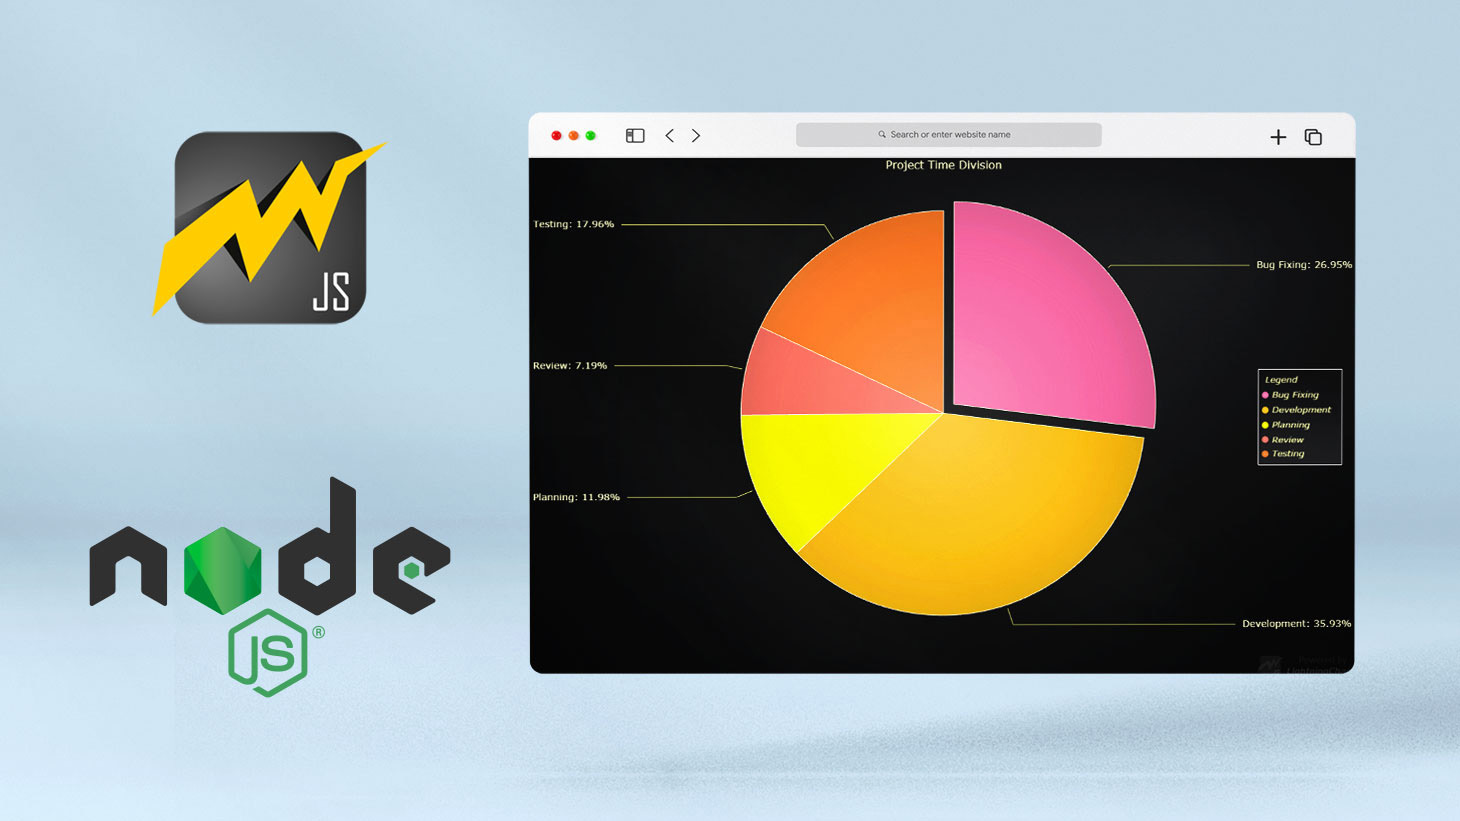
Create a JavaScript Pie Chart with NodeJS, TypeScript & LightningChart

LightningChart is an API focused on data representation, using a wide variety of charts (2D and 3D), with an intuitive implementation and wide compatibility with various development platforms.

There are currently two solutions for developing with LightingCharts.

  • LightningChart .NET for desktop applications (supports WPF, UWP, and WinForms)
  • LightningChart JS for web, mobile, and desktop applications.

Today, we are going to do a short tutorial on how to generate a pie chart using Node JS, TypeScript, and LigningCharts JS.

To see how to get LightningChart JS for free, visit the Community license page.

Read full article
LightningChart-high-performance-charting-controls-charting-library

Why Performance Matters in Data Visualization in 2022?

I was doing a Google search a couple of days ago and particularly, I wanted to know what are the options for developers who need to visualize large amounts of data points within applications. To my surprise, I couldn't really find that many solutions, and in fact, most of the results I got were from already many years ago.

But there was one result that grabbed my attention and it was a Reddit post about a user asking how to plot billions of data points? While other users replied saying "try using Power BI or Excel", other users suggested workarounds like using a Pandas DataFrame in the Python environment in order to store and manipulate data. But the user who posted the question didn't want to store and manipulate data, the user wanted to visualize the data!

So, how to visualize billions of data points and why would you do that? 

Read full article
Medical-Data-Visualization-MedTech-Applications

Data Visualization in Medical & Healthcare Applications

The fact that data and data visualization are everywhere in today's world, makes me wonder how data visualization impacts medical applications and what's their role within patients' diagnoses? Undoubtedly, patients trust their wellness on healthcare professionals' criteria and decisions but what do doctors, nurses, practitioners, and other healthcare professionals base their judgment and decisions on?

Read full article
high-performance-charting-controls-in-a-fintech-app

High-Performance Charting Controls for Fintech App Development

Money makes the world go round and as such, tracking and controlling financial transactions and information are some of the most important activities to do for any business, financial institution, or individual in today's connected world. And for that, you've got Fintech applications.

Depending on the purpose, Fintech applications may have different features that make them relevant for users. For example, stock market applications usually feature high-performance technical indicators to visualize and monitor measures such as price changes and market indexes while banking applications might allow private users to track their expenses and apply for credits without having to put a foot in the bank.

Read full article
data-visualization-motorsports

High-Performance Data Visualization in Motorsports

Large companies in the motorsports industry are collecting huge volumes of real-time data coming from different sources on and off the pitch during racing competitions.

These data are both collected from the car and the car engine itself and are meant to help drivers and engineers to understand the behavior of the machine in a dynamic environment.

Understanding the behavior of the vehicle during a race is key to making improvements in the performance of the entire racing team (such as Formula 1 teams!). High-performance data visualization in motorsports can lead a team to an improvement in performance during a race.

Read full article

Data Visualization Components for React Applications

React is one of the most popular front-end development frameworks on the web in the year 2021. It is a free and open-source front-end JS library that is used to build interactive user interfaces for Single Page Applications (SPAs).

(Its rising popularity comes from the fact that it can be used by a user with a basic understanding of HTML and JavaScript!)

But not only that, React data visualization becomes efficient with its distinct features such as virtual DOM and JSX. Visualizing a large amount of data can be a tedious task!

Read full article